
ARTICLES
The E-Marketplace Investment: Avoiding a $15 Million Mistake
How High Tech Firms Find Replacement Technology
Avoiding the New Economy Backlash
One-to-One Pricing in the New Economy
The Erosion of Comparative Advantage (Part I)
The Erosion of Comparative Advantage (Part II)
Linking Strategy to What Customers Value
Organizing Corporate Development Activities of Acquisitions and Ventures
Uncovering Profitability
“Why aren’t we as profitable as our competitors?” If you’re like most business executives we know, you probably ask yourself this a lot.
After all, in many industries the profitability “spread” (as measured by ROE) among competitors in the middle two quartiles can be as much as 15 points. And it’s growing! Firms below median profitability face an even faster slide to marginality. That’s enough to keep any executive up at night.
But there is hope! By finding the fundamental drivers to competitive superiority in your business, you can determine the steps-and costs-for improving performance.
In every business, a few leverageable economic relationships determine why one company does better than another. We call these the key sources of comparative advantage.
And no-it probably isn’t market share. Market share’s an outgrowth of competitive superiority, it’s rarely the cause of it.
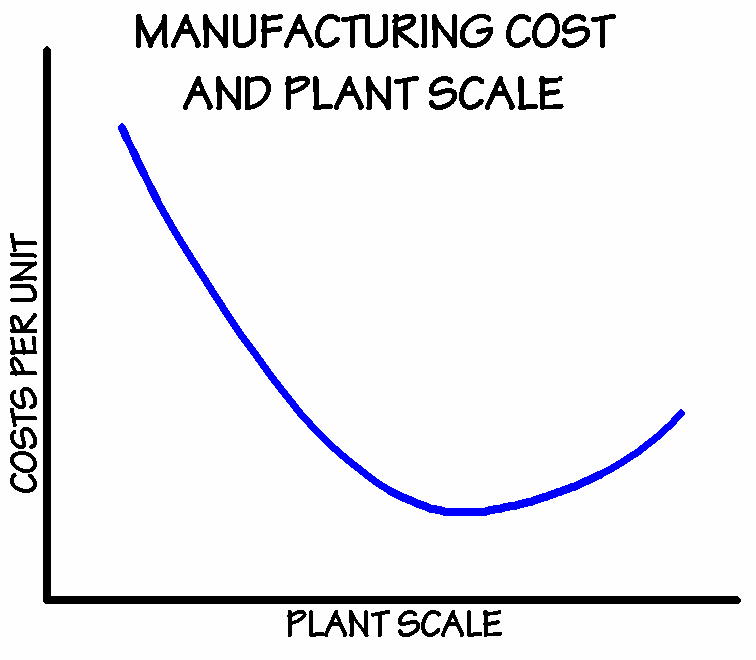
Some sources of comparative advantage are well understood. Manufacturing costs are usually progressively leverageable with plant scale…up to a point.
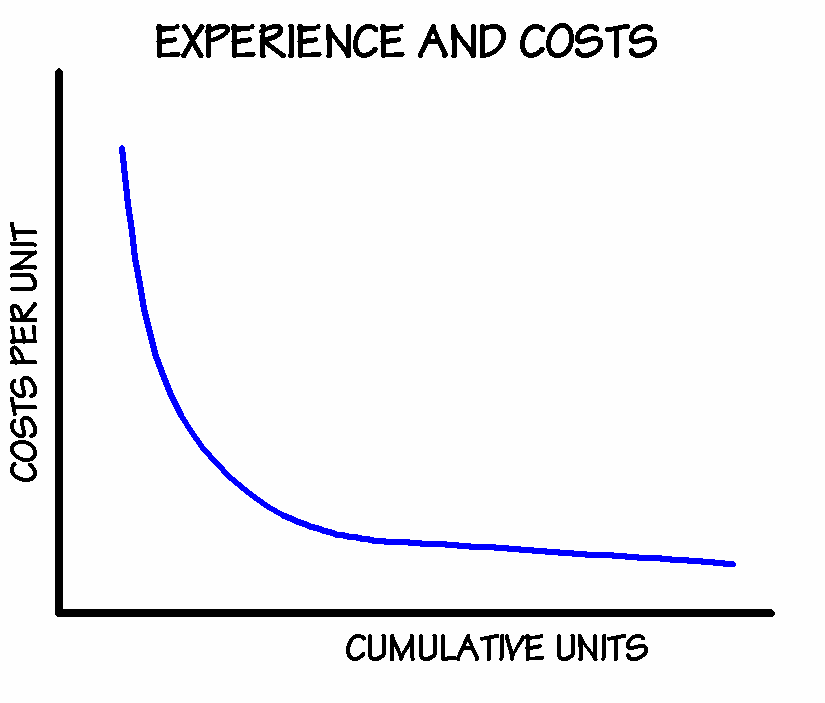
And remember this one? Costs go down with experience:
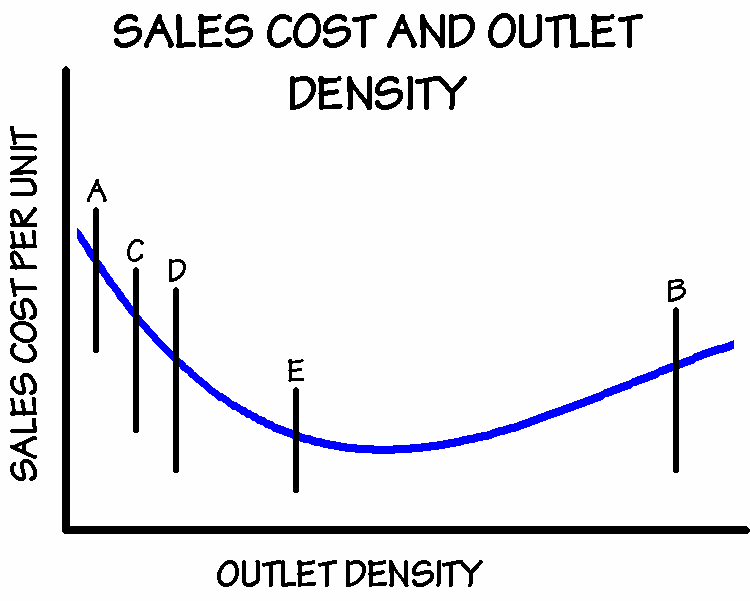
But chances are your industry’s compelling economic relationships are more subtle. For example, in one packaged goods business we’ve studied, product availability and brand recognition are vital to sales. Most companies try to achieve product availability through outlet penetration and strong distribution, supported by a lot of inventory. Brand recognition is achieved by raw advertising expenditures. Traditional competitive analysis goes no further.
But here are the actual economic relationships that would lead to one company’s competitive superiority-the key sources of comparative advantage:
- Outlet penetration is a function of total product line breadth. The broader the product line, the higher the propensity for an outlet to carry any one product.
- Sales and distribution costs are related to outlet density. Marketing personnel can detail more stores in a denser selling area. (Figure 3 below shows how different competitors spread across the sales cost-outlet density relationship)
- Advertising productivity per unit is related to volume. More sales supports more advertising. And larger advertisers buy a little better.
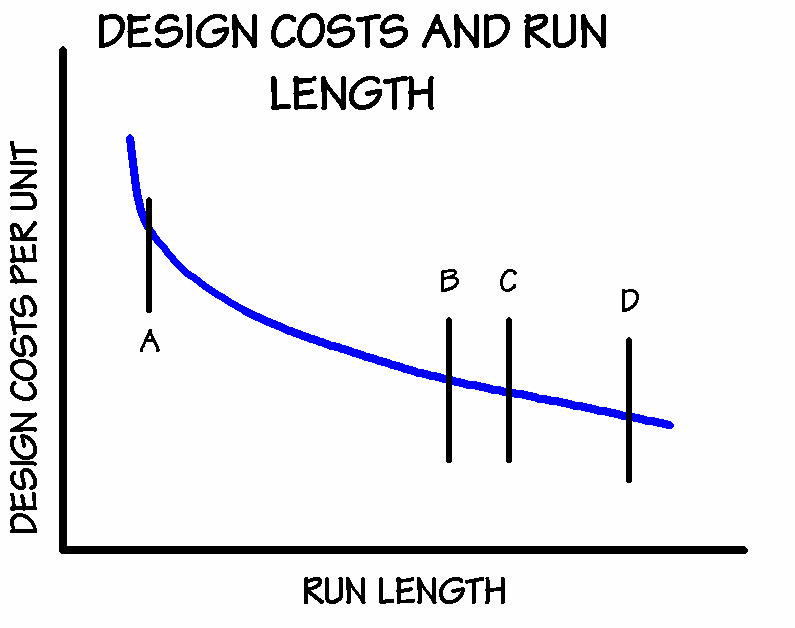
Here’s another example: In a machine tool business, companies compete not only on quality, but on parts availability as well. This requires high inventory levels and instant response. But one company improved profitability by understanding and acting on the following relationships.
- Costs of inventory and product support are related to product line breadth. Simplify the product line and you reduce costs with no drop in service.
- Manufacturing costs per unit decrease as the number of copies produced of each model increases.
- Design costs per unit decrease as the number of copies produced of each model increases. (Figure 4 below shows how different competitors spread across the design costs relationship.).
Defining and understanding these economic relationships cannot be casual, vague, or too financially oriented, if it is to result in material performance improvement. Usually exhaustive field research and rigorous micro-economic analysis is necessary. But the results-in competitiveness and performance-are worth it.
At Easton Consultants, we help clients build strategies that lead to superior performance by uncovering the key sources of comparative advantage in their businesses. That is the heart of our strategy practice.
Copyright © 2003,
Easton Consultants. All rights reserved.
Questions, Comments, Suggestions?
Send us feedback.
No part of this material may be reproduced, translated, transmitted, framed, or stored in a retrieval system for public or private use without the written permission of the publisher.